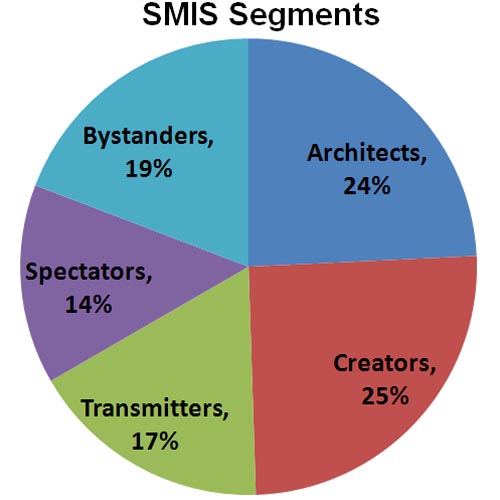
Nearly a year ago when we first introduced our Social Media Impact Score, we segmented the world of social media users (or non-users) into 5 distinct categories – architects, creators, transmitters, spectators and bystanders. Today, it looks virtually the same with very little change.
Still, a sizeable percentage of online users (almost 1 in 2) don’t let the Internet world slip by without having their say… these architects and creators either post their own original content, or critique or comment on someone else’s at least once every week.
However, about 1 in 3 online users continue to surf the Internet passively (either as transmitters or spectators), viewing, storing and/or forwarding information on the Internet without actively weighing in.
And, about 1 in 4 online users continue to act as bystanders, not even viewing Internet content on a weekly basis. My media-hungry (or it obsessive?) self can’t help but ask how this category still exists but anyway….

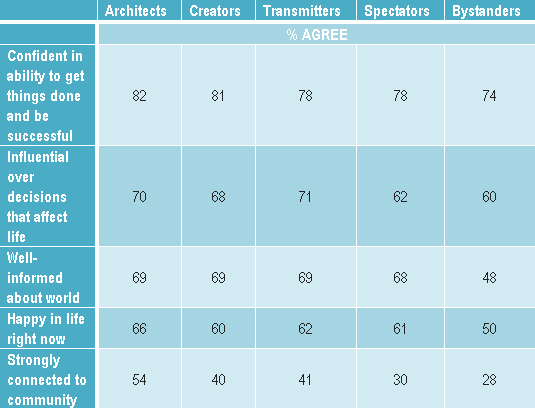
All that said, and not surprisingly, the psychographic differences between the architects and the bystanders are about as large as the gulf of social media usage between them. For example:

This chart begs the question of the chicken and the egg? Does social media compel online users to feel more connected to their communities? Or, rather are more connected people more likely drawn to social media? I have the same question re: feeling happy and being well-informed. Let us know your thoughts.
Leave a Reply